
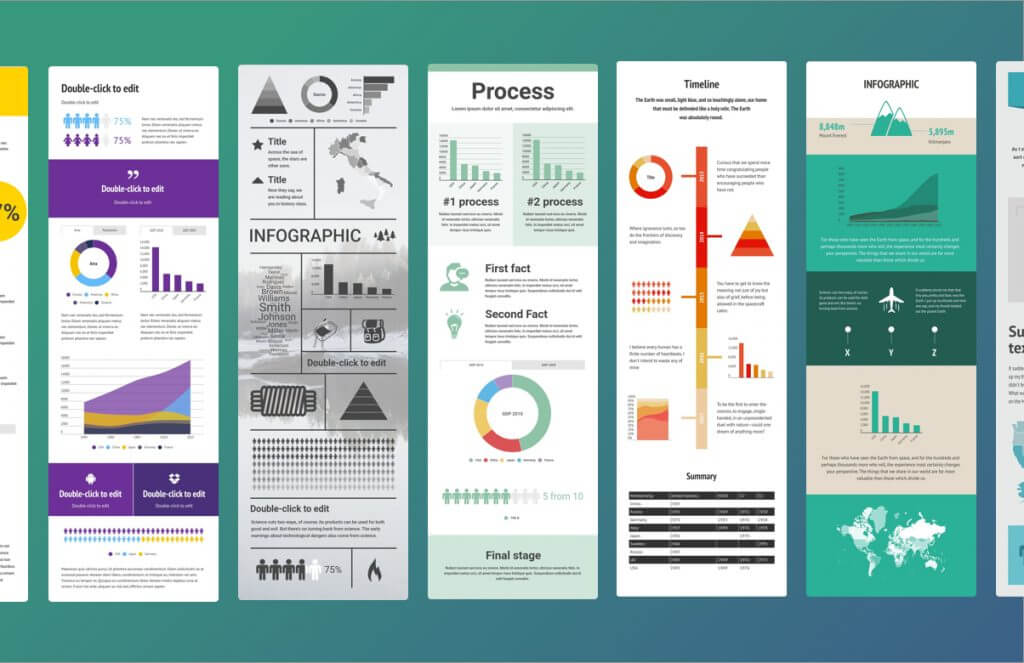
Infographics are powerful visual tools that can successfully communicate complicated information in a visually appealing and simply accessible manner. You can use a range of tools built expressly to generate eye-catching infographics. Here is a list of the top 10 infographic creation tools:
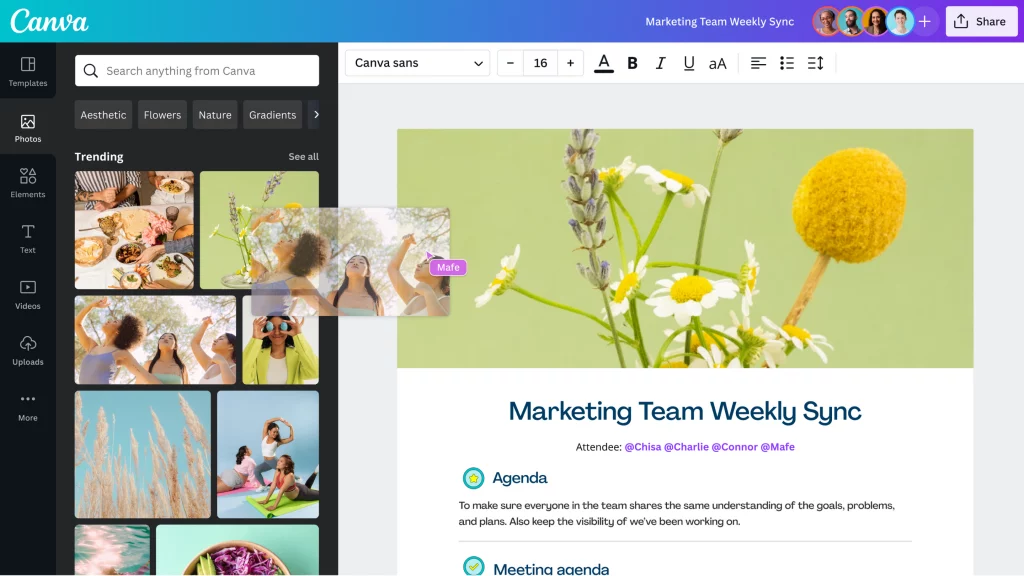
Canva
Canva is a well-known visual design platform providing various AI-powered infographics tools. It offers a vast library of pre-designed themes, icons, photos, and fonts, making creating infographics with a polished appearance simple. With Canvas drag-and-drop interface and smart AI suggestions, even novices can quickly generate visually beautiful infographics.
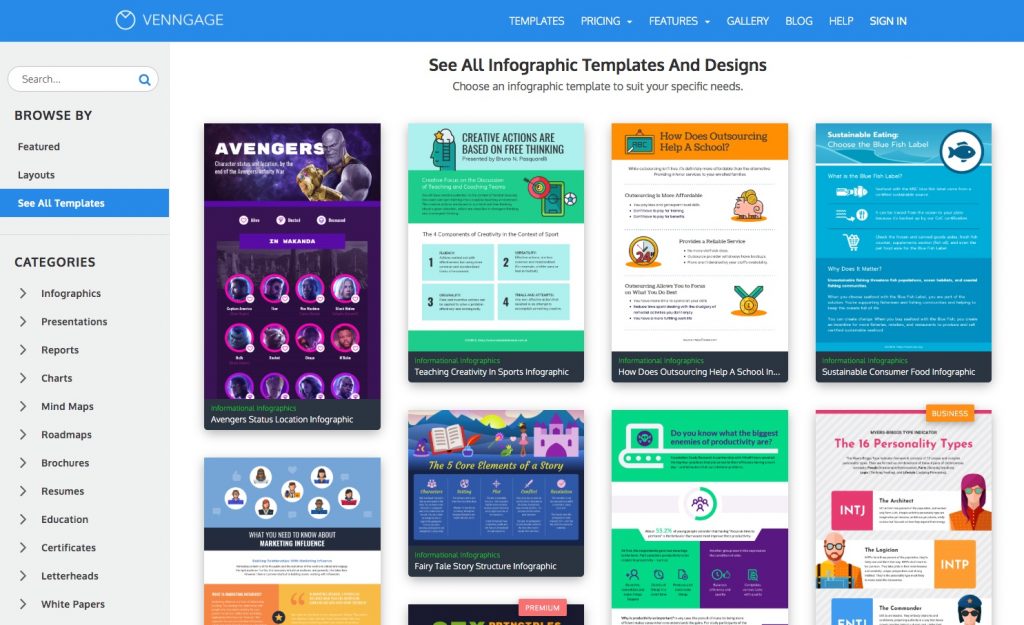
Venngage
Venngage is an AI-powered infographic tool with a user-friendly interface and extensive customization options. It offers a variety of templates and themes to fit a wide range of applications and businesses. Venngage assists you in selecting the appropriate colors, fonts, and layouts to produce visually appealing infographics due to its AI-driven suggestions.
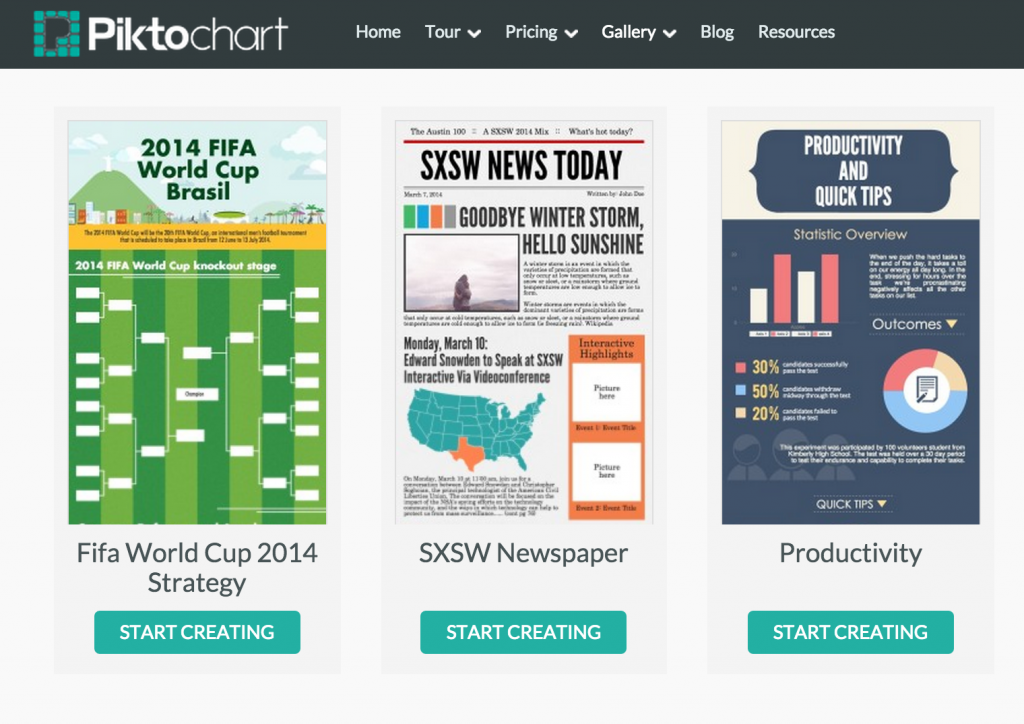
Piktochart
Piktochart is a flexible infographic AI tool that enables users to create visually arresting reports, presentations, and more. It has an extensive library of themes, icons, images, customized charts, and maps. The AI functions of Piktochart help users choose the proper design elements, resulting in aesthetically beautiful and helpful infographics.
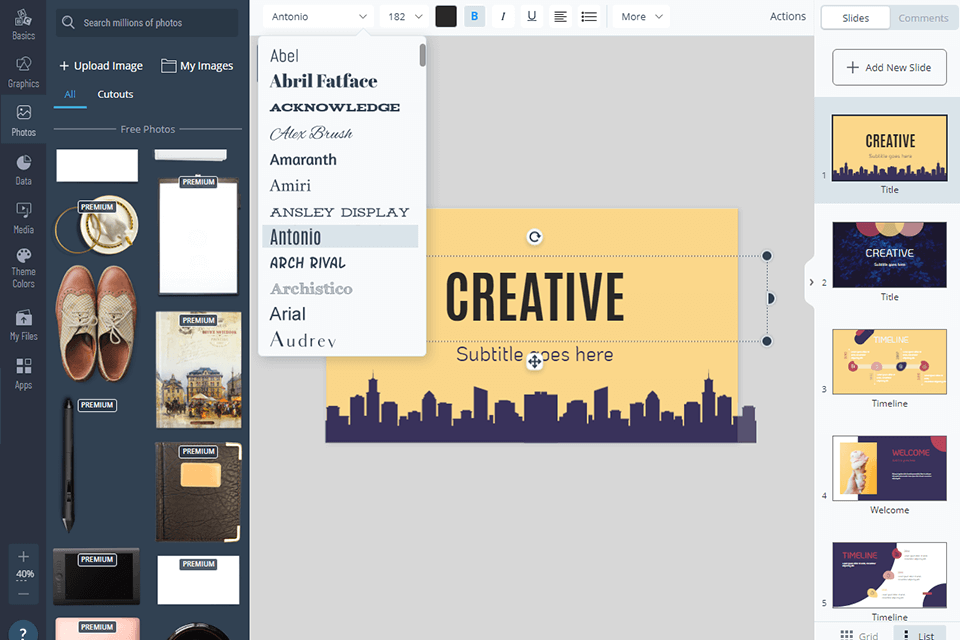
Visme
Visme is an all-in-one design studio that uses AI technology to make creating infographics easier. It has a plethora of customizable layouts, pictures, icons, and data visualization capabilities. You can create unique infographics that communicate your message using Visme’s AI-driven design suggestions and real-time collaboration tools.
Infogram
Infogram is a potent infographic tool that uses artificial intelligence to produce dynamic and data-driven images. It provides numerous diagrams, maps, and icons to help in data visualization. Infogram’s AI algorithms dynamically modify the visuals to convey data in the most entertaining and informative way possible.
Also Read: Top 10 Global Business Titans
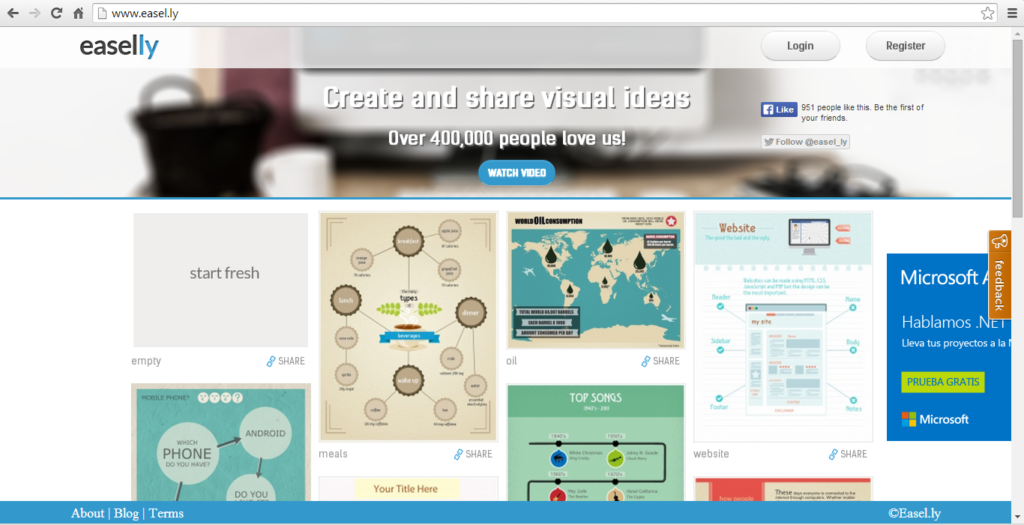
Easel.ly
Easel.ly is a user-friendly AI-powered application that enables users to design eye-catching infographics with drag-and-drop capabilities. It has abundant customizable themes, shapes, symbols, and fonts for visually appealing presentations. The AI assistance provided by Easel.ly assists users in optimizing design elements and layouts for maximum impact.
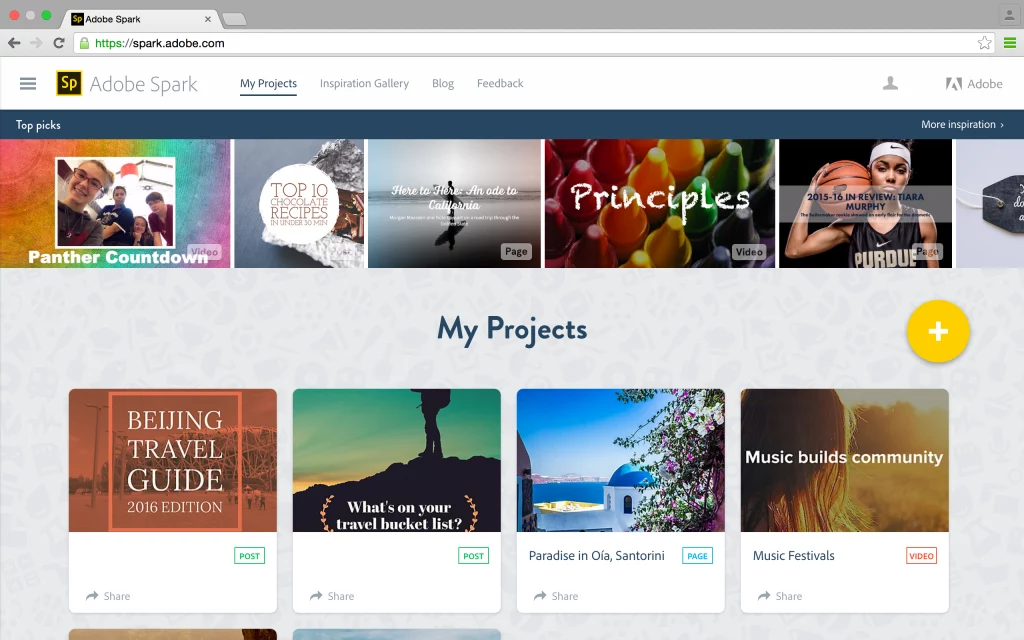
Adobe Spark
Adobe Spark is a popular graphic design tool that combines AI to make creating infographics more straightforward. It includes a variety of templates, graphics, and fonts, as well as customizing possibilities. Users can effortlessly create professional-looking infographics that stand out using Adobe Spark’s AI-driven capabilities.
DesignCap
DesignCap is an AI-powered infographic tool that makes it simple to produce eye-catching designs quickly. It offers a range of layouts, icons, charts, and graphs for effectively presenting data. With DesignCap, you can easily create stunning infographics using AI algorithms that recommend design components and layouts that combine well with your information.

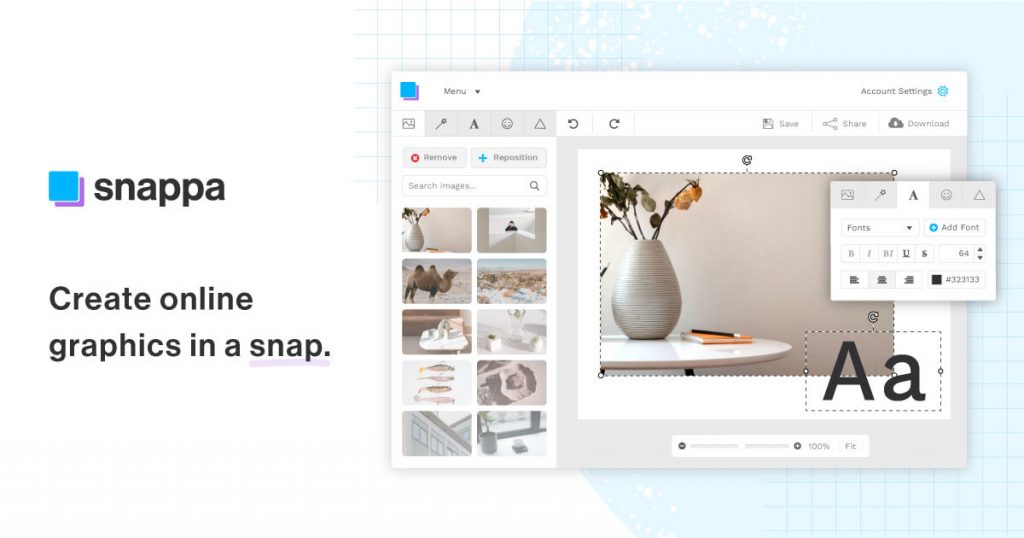
Snappa
Snappa is an intuitive infographic AI tool that enables users to produce beautiful visuals without prior design expertise. It has a massive collection of templates, graphics, icons, fonts, and customizable elements. Users can improve their designs and develop infographics with a strong visual presence with Snappa’s AI-driven features.
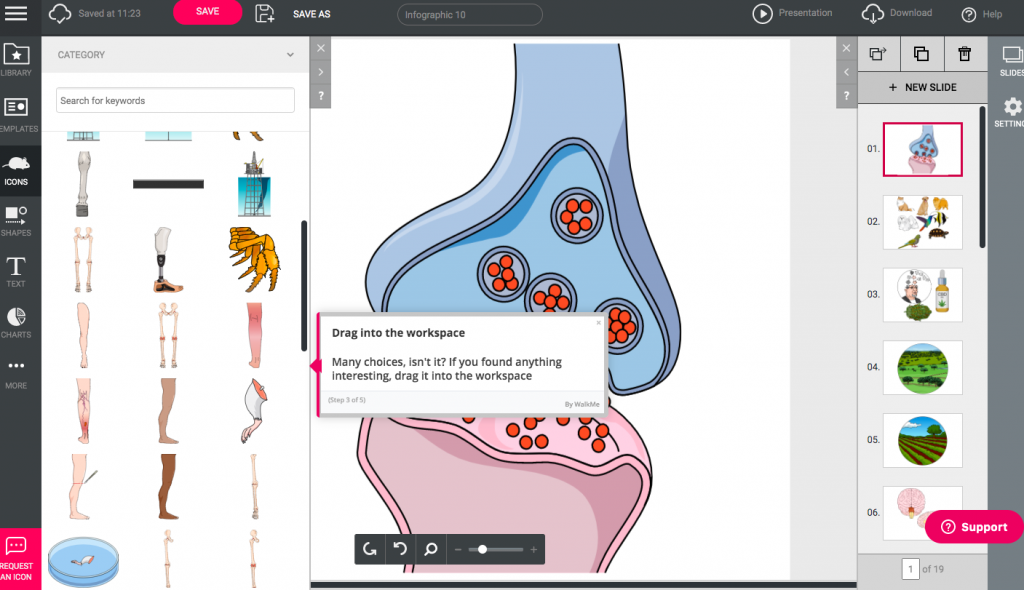
Mind the Graph
This AI-powered program was created to produce infographics for the fields of science and medicine. It features a vast collection of scientific symbols, drawings, and templates. Users may effortlessly generate aesthetically appealing and accurate infographics with Mind the Graph’s AI support.
Conclusion
Each of these infographic tools has its unique features and advantages. The choice depends on your specific requirements, design skills, and budget. Experimenting with different tools can help you find the one that best suits your needs and allows you to create compelling infographics efficiently.
IT/Telecom Marketing Specialist.